KerasTuner#
import pandas as pd
import numpy as np
import matplotlib.pyplot as plt
from sklearn.model_selection import train_test_split
from sklearn.preprocessing import StandardScaler
from keras.models import Sequential
from keras.layers import Dense
import keras
import warnings  # Para ignorar mensajes de advertencia

warnings.filterwarnings("ignore")
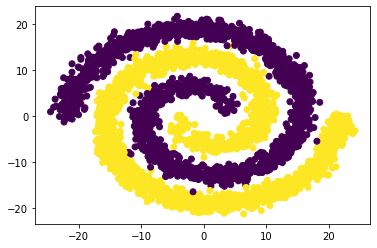
df = pd.read_csv("spiral.csv", sep=",", decimal=".")
print(df.head())
         X1        X2    y
0  13.31596  -5.47317  0.0
1  16.70656   1.26700  0.0
2   7.18348   7.29934  1.0
3  -7.94940 -14.77444  1.0
4  -5.96108 -18.68620  1.0
plt.scatter(df.iloc[:,0],df.iloc[:,1], c = df.iloc[:,2])
plt.show()
Conjunto de train y test:#
X = pd.concat([df[["X1", "X2"]]], axis=1)
print(X)
            X1        X2
0     13.31596  -5.47317
1     16.70656   1.26700
2      7.18348   7.29934
3     -7.94940 -14.77444
4     -5.96108 -18.68620
...        ...       ...
3995   4.67165  11.72679
3996  -9.34366   0.81879
3997 -13.08116 -14.54117
3998  10.66048 -17.28003
3999  12.35733  -8.63444

[4000 rows x 2 columns]
y = df["y"]
print(y)
0       0.0
1       0.0
2       1.0
3       1.0
4       1.0
       ...
3995    1.0
3996    0.0
3997    1.0
3998    1.0
3999    0.0
Name: y, Length: 4000, dtype: float64
X_train, X_test, y_train, y_test = train_test_split(X, y, test_size=0.2, random_state=0)
Escalado de variables:#
sc = StandardScaler()
sc.fit(X_train)
X_train = sc.transform(X_train)
X_test = sc.transform(X_test)
KerasTuner:#
Instalar KerasTuner: !pip install keras-tuner -q
import keras_tuner
Optimización de hiperparámetros:#
Función para generar modelos, esta función devuelve el modelo compilado y tiene hiperparámetros que se ajustarán.
def create_model(hp):   # solo el argumento hp.

    units = hp.Int("units", min_value=2, max_value=8, step=1)                 # Hiperparámetro a ajustar
    activation = hp.Choice("activation", ["relu", "tanh", "sigmoid", "selu"]) # Hiperparámetro a ajustar
    optimizer = hp.Choice("optimizers", ["adam", "rmsprop", "sgd"])           # Hiperparámetro a ajustar
    n_hidden = hp.Int("n_hidden", min_value=2, max_value=4, step=1)           # Hiperparámetro a ajustar

    model = Sequential()

    # Dimensión de las entradas para la primera capa:
    model.add(keras.layers.InputLayer(input_shape=(X.shape[1],)))

    # Loop para las capas ocultas:
    for layer in range(n_hidden):
        model.add(Dense(units, activation=activation))

    model.add(Dense(1, activation = "sigmoid"))
    model.compile(loss = "binary_crossentropy", optimizer = optimizer, metrics = ["accuracy"])


    return model
Instancia para el sintonizador para realizar el ajuste a los hiperparámetros.
Se debe especificar el objetivo a optimizar:
objective='val_accuracy': para clasificación.objective='val_mse': para regresión.
Especificar el número máximo de epochs para entrenar max_epochs=,
por defecto es 100. Se recomienda establecer esto en un valor
ligeramente más alto que las épocas esperadas para la convergencia del
modelo más grande.
El algoritmo tiene una detención anticipada (early stopping) para converger rápidamente a un modelo de alto rendimiento.
El algoritmo entrena una gran cantidad de modelos durante algunas epochs y lleva a delante solo la mitad de los modelos con el mejor rendimiento a la siguiente ronda.
tuner = keras_tuner.Hyperband(create_model,
                              objective='val_accuracy',
                              max_epochs=100,
                              directory='optimización_hiperparámetros')
INFO:tensorflow:Reloading Oracle from existing project optimización_hiperparámetrosuntitled_projectoracle.json
INFO:tensorflow:Reloading Tuner from optimización_hiperparámetrosuntitled_projecttuner0.json
Se creó una carpeta en el disco con el nombre
optimización_hiperparámetros.
Búsqueda de los hiperparámetros:
Este paso se realiza con el método search() que posee los mismos
argumentos que fit().
tuner.search(X_train, y_train,
             validation_data = (X_test, y_test),
             epochs = 200,
             verbose = 1)
INFO:tensorflow:Oracle triggered exit
Hiperparámetros óptimos:
best_hps = tuner.get_best_hyperparameters()[0]
best_hps.get("units")
6
best_hps.get("activation")
'tanh'
best_hps.get("optimizers")
'adam'
best_hps.get("n_hidden")
2
Ajuste con la mejor configuración de hiperparámetros:
hypermodel = create_model(best_hps)
history = hypermodel.fit(X_train, y_train,
                         validation_data = (X_test, y_test),
                         epochs = 1000,
                         verbose = 0)
Número óptimo de epoch:
val_acc_per_epoch = history.history['val_accuracy']
best_epoch = val_acc_per_epoch.index(max(val_acc_per_epoch)) + 1
print('Best epoch: %d' % (best_epoch,))
Best epoch: 887
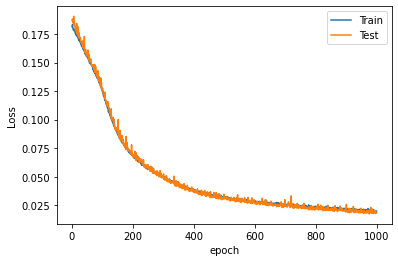
plt.plot(range(1, len(history.epoch) + 1), history.history["loss"], label="Train")
plt.plot(range(1, len(history.epoch) + 1), history.history["val_loss"], label="Test")
plt.xlabel("epoch")
plt.ylabel("Loss")
plt.legend();
Evaluación del modelo:
hypermodel.evaluate(X_test, y_test, verbose=0)
[0.018545441329479218, 0.9962499737739563]
y_pred = hypermodel.predict(X_test, verbose = 0)
y_pred[0:5]
array([[4.0814998e-03],
       [9.9986339e-01],
       [7.2828634e-04],
       [9.9996448e-01],
       [6.1287057e-05]], dtype=float32)
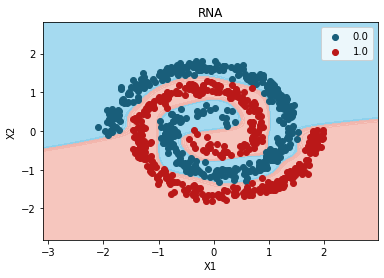
from matplotlib.colors import ListedColormap

X_Set, y_Set = X_test, y_test
X1, X2 = np.meshgrid(
    np.arange(start=X_Set[:, 0].min() - 1, stop=X_Set[:, 0].max() + 1, step=0.01),
    np.arange(start=X_Set[:, 1].min() - 1, stop=X_Set[:, 1].max() + 1, step=0.01),
)
plt.contourf(
    X1,
    X2,
    hypermodel.predict(np.array([X1.ravel(), X2.ravel()]).T).reshape(X1.shape),
    alpha=0.75,
    cmap=ListedColormap(("skyblue", "#F3B3A9")), verbose = 0
)
plt.xlim(X1.min(), X1.max())
plt.ylim(X2.min(), X2.max())
for i, j in enumerate(np.unique(y_Set)):
    plt.scatter(
        X_Set[y_Set == j, 0],
        X_Set[y_Set == j, 1],
        c=ListedColormap(("#195E7A", "#BA1818"))(i),
        label=j,
    )
plt.title("RNA")
plt.xlabel("X1")
plt.ylabel("X2")
plt.legend()
plt.show()
10715/10715 [==============================] - 7s 668us/step
c argument looks like a single numeric RGB or RGBA sequence, which should be avoided as value-mapping will have precedence in case its length matches with x & y.  Please use the color keyword-argument or provide a 2D array with a single row if you intend to specify the same RGB or RGBA value for all points.
c argument looks like a single numeric RGB or RGBA sequence, which should be avoided as value-mapping will have precedence in case its length matches with x & y.  Please use the color keyword-argument or provide a 2D array with a single row if you intend to specify the same RGB or RGBA value for all points.